1. 프로메테우스
1.1. 정의
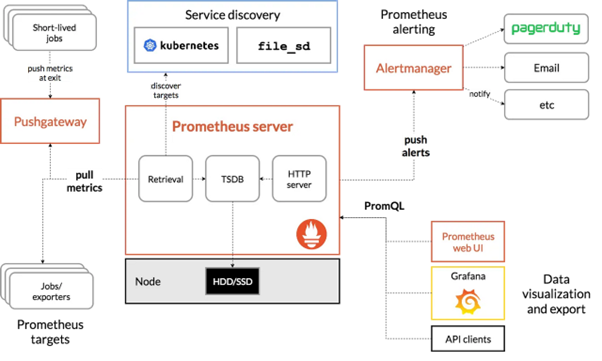
프로메테우스는 쿠버네티스 환경에서 사용되는 오픈소스 모니터링 및 경고 도구이다. 이는 애플리케이션 및 인프라스트럭처 모니터링을 위해 설계되었으며, 컨테이너화된 환경에서의 다양한 지표(metric)를 수집, 저장 및 시각화 할 수 있다. 프로메테우스는 확장 가능하며 유연한 데이터 수집을 지원하며, 서버나 서비스의 성능과 가용성을 추적하고 이상 상태를 식별하여 조기 경고 및 대응이 가능하도록 돕는 역할 을 한다. 이를 통해 시스템 관리자와 개발자들은 애플리케이션 및 인프라의 동작을 실시간으로 모니터링하고 문제를 식별하여 빠르게 대응할 수 있다.
1.2. 구조
1.3. 설치 과정
| [admin@ubu22-01 ~ (kubernetes-admin@cluster.local:kube-system)]$ helm repo add prometheus-community https://prometheus-community.github.io/helm-charts "prometheus-community" has been added to your repositories [admin@ubu22-01 ~ (kubernetes-admin@cluster.local:kube-system)]$ helm repo update Hang tight while we grab the latest from your chart repositories... ...Successfully got an update from the "harbor" chart repository ...Successfully got an update from the "argo" chart repository ...Successfully got an update from the "prometheus-community" chart repository ...Successfully got an update from the "gitlab" chart repository Update Complete. ⎈Happy Helming!⎈ [admin@ubu22-01 ~ (kubernetes-admin@cluster.local:kube-system)]$ helm pull prometheus-community/kube-prometheus-stack [admin@ubu22-01 ~ (kubernetes-admin@cluster.local:kube-system)]$ tar xzvf kube-prometheus-stack-48.3.2.tgz kube-prometheus-stack/Chart.yaml ... [admin@ubu22-01 ~ (kubernetes-admin@cluster.local:kube-system)]$ rm -rf kube-prometheus-stack-48.3.2.tgz [admin@ubu22-01 ~ (kubernetes-admin@cluster.local:kube-system)]$ cd kube-prometheus-stack/ [admin@ubu22-01 ~/kube-prometheus-stack (kubernetes-admin@cluster.local:kube-system)]$ vi values.yaml |
| # vi values.yaml 설정파일 ... 462 ## Service type 463 ## 464 type: NodePort ... 2579 ## Service type 2580 ## 2581 type: NodePort ... 3017 ## If true, a nil or {} value for prometheus.prometheusSpec.serviceMonitorSelector will cause the 3018 ## prometheus resource to be created with selectors based on values in the helm deployment, 3019 ## which will also match the servicemonitors created 3020 ## 3021 serviceMonitorSelectorNilUsesHelmValues: false ... 3110 ## Maximum size of metrics 3111 ## 3112 retentionSize: "10GiB" ... 3210 ## Prometheus StorageSpec for persistent data 3211 ## ref: https://github.com/prometheus-operator/prometheus-operator/blob/main/Documentation/user-guides/storage.md 3212 ## 3213 storageSpec: 3214 ## Using PersistentVolumeClaim 3215 ## 3216 volumeClaimTemplate: 3217 spec: 3218 storageClassName: "openebs-hostpath" 3219 accessModes: ["ReadWriteOnce"] 3220 resources: 3221 requests: 3222 storage: 15Gi ... |
| [admin@ubu22-01 ~/kube-prometheus-stack (kubernetes-admin@cluster.local:kube-system)]$ vi charts/grafana/values.yaml 180 ## Expose the grafana service to be accessed from outside the cluster (LoadBalancer service). 181 ## or access it from within the cluster (ClusterIP service). Set the service type and the port to serve it. 182 ## ref: http://kubernetes.io/docs/user-guide/services/ 183 ## 184 service: 185 enabled: true 186 type: LoadBalancer ... 322 ## Enable persistence using Persistent Volume Claims 323 ## ref: http://kubernetes.io/docs/user-guide/persistent-volumes/ 324 ## 325 persistence: 326 type: pvc 327 enabled: true 328 storageClassName: "openebs-hostpath" # pod has unbound immediate PersistentVolumeClaims. preemption: 0/3 nodes are available: 3 No preemption victims found for incoming pod 에러가 나면 스토리지가 존재하지 않는것. 스토리지를 추가하거나 PVC부분을 주석처리 |
| [admin@ubu22-01 ~/kube-prometheus-stack (kubernetes-admin@cluster.local:kube-system)]$ k create ns monitoring namespace/monitoring created [admin@ubu22-01 ~/kube-prometheus-stack (kubernetes-admin@cluster.local:kube-system)]$ k ns monitoring Context "kubernetes-admin@cluster.local" modified. Active namespace is "monitoring". [admin@ubu22-01 ~/kube-prometheus-stack (kubernetes-admin@cluster.local:monitoring)]$ helm install prometheus -f values.yaml . NAME: prometheus LAST DEPLOYED: Tue Aug 22 15:37:41 2023 NAMESPACE: monitoring STATUS: deployed REVISION: 1 NOTES: kube-prometheus-stack has been installed. Check its status by running: kubectl --namespace monitoring get pods -l "release=prometheus" |
| [admin@ubu22-01 ~/kube-prometheus-stack (kubernetes-admin@cluster.local:monitoring)]$ kgs NAME TYPE CLUSTER-IP EXTERNAL-IP PORT(S) AGE SELECTOR ... prometheus-prometheus-node-exporter ClusterIP 10.233.23.100 <none> 9100/TCP 5m28s app.kubernetes.io/instance=prometheus,app.kubernetes.io/name=prometheus-node-exporter [admin@ubu22-01 ~/kube-prometheus-stack (kubernetes-admin@cluster.local:monitoring)]$ k port-forward svc/prometheus-prometheus-node-exporter 8080:9100 Forwarding from 127.0.0.1:8080 -> 9100 Forwarding from [::1]:8080 -> 9100 # 10.233.23.100:9100에 접속해서 확인 [admin@control ~/kubespray/kube-prometheus-stack (kubernetes-admin@cluster.local:monitoring)]$ kgs NAME TYPE CLUSTER-IP EXTERNAL-IP PORT(S) AGE SELECTOR ... prometheus-grafana LoadBalancer 10.233.57.230 192.168.0.205 80:31063/TCP 8s app.kubernetes.io/instance=prometheus,app.kubernetes.io/name=grafana prometheus-kube-prometheus-alertmanager NodePort 10.233.57.205 <none> 9093:30903/TCP,8080:31637/TCP 8s alertmanager=prometheus-kube-prometheus-alertmanager,app.kubernetes.io/name=alertmanager ... prometheus-kube-prometheus-prometheus NodePort 10.233.46.79 <none> 9090:30090/TCP,8080:31759/TCP 8s app.kubernetes.io/name=prometheus,operator.prometheus.io/name=prometheus-kube-prometheus-prometheus ... # 192.168.0.205로 그라파나 접속 [admin@control ~/kubespray/kube-prometheus-stack (kubernetes-admin@cluster.local:monitoring)]$ kgn NAME STATUS ROLES AGE VERSION INTERNAL-IP EXTERNAL-IP OS-IMAGE KERNEL-VERSION CONTAINER-RUNTIME control Ready control-plane 25h v1.27.4 192.168.0.106 <none> Ubuntu 22.04.3 LTS 6.2.0-26-generic containerd://1.7.3 node1 Ready <none> 25h v1.27.4 192.168.0.107 <none> Ubuntu 22.04.3 LTS 6.2.0-26-generic containerd://1.7.3 node2 Ready <none> 25h v1.27.4 192.168.0.108 <none> Ubuntu 22.04.3 LTS 6.2.0-26-generic containerd://1.7.3 # 192.168.0.106:30090으로 프로메테우스 접속 # 192.168.0.106:30903으로 alertmanager 접속 |
** user-id 와 password 확인 하는법
| [admin1@ubu22-01 kube-prometheus-stack (kubernetes-admin@cluster.local:monitoring)]$ k get secrets prometheus-grafana -o yaml apiVersion: v1 data: admin-password: cHJvbS1vcGVyYXRvcg== admin-user: YWRtaW4= ... [admin1@ubu22-01 kube-prometheus-stack (kubernetes-admin@cluster.local:monitoring)]$ echo YWRtaW4= | base64 -d && echo admin # 유저 아이디 확인 [admin1@ubu22-01 kube-prometheus-stack (kubernetes-admin@cluster.local:monitoring)]$ echo cHJvbS1vcGVyYXRvcg== | base64 -d && echo prom-operator # password 확인 |
1.4. 결과 확인
